


Features
Flexible metric editor
Regex-based metric filtering
Client-side data processing functions
Template variables support
Templated dashboards support
Group, host, application or item names can be replaced with a template variable. This allows you to create generic dashboards that can quickly be changed to show stats for a specific cluster, server or application.
Annotations support
Display zabbix events on graphs
Show acknowledges for problems
Triggers panel
Panel for showing Zabbix triggers (like Last 20 issues) with some customizable features.
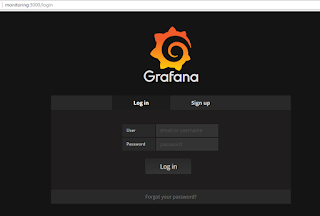
หลังจาก Login เข้าระบบ Grafana ผ่านทาง Link : http:// ชื่อ หรือ ไอพี :3000
User : Admin
Password : Admin
หลังจากเข้าระบบแล้ว
ให้เปิดใช้งาน Plugin Zabbix

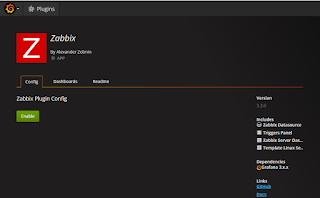
หลังจากเปิดใช้งาน Plugin Zabbix เรียบร้อยแล้ว
ให้คลิ๊ก Menu ข้างบนตรง Logo ==>> จะมี โลโก้ Zabbix โชว์

ปล.หาไม่มีปลั๊กอิน โชว์ ต้องติดตั้งปลั๊กอินใหม่ โดย ใช้คำสั่งนี้
[root@zabbix ~]# grafana-cli plugins install alexanderzobnin-zabbix-app
[root@zabbix ~]# systemctl restart grafana-server
เริ่มขั้นตอนการตั้งค่าเพื่อดึงข้อมูลจาก Zabbix
ไปที่หน้า Home หรือ ไปที่หน้า http:// ชื่อ หรือ ไอพี :3000

Flexible metric editor
Regex-based metric filtering
Client-side data processing functions
Template variables support
Templated dashboards support
Group, host, application or item names can be replaced with a template variable. This allows you to create generic dashboards that can quickly be changed to show stats for a specific cluster, server or application.
Annotations support
Display zabbix events on graphs
Show acknowledges for problems
Triggers panel
Panel for showing Zabbix triggers (like Last 20 issues) with some customizable features.
หลังจาก Login เข้าระบบ Grafana ผ่านทาง Link : http:// ชื่อ หรือ ไอพี :3000
User : Admin
Password : Admin

หลังจากเข้าระบบแล้ว
ให้เปิดใช้งาน Plugin Zabbix


ให้คลิ๊ก Menu ข้างบนตรง Logo ==>> จะมี โลโก้ Zabbix โชว์

ปล.หาไม่มีปลั๊กอิน โชว์ ต้องติดตั้งปลั๊กอินใหม่ โดย ใช้คำสั่งนี้
[root@zabbix ~]# grafana-cli plugins install alexanderzobnin-zabbix-app
[root@zabbix ~]# systemctl restart grafana-server
เริ่มขั้นตอนการตั้งค่าเพื่อดึงข้อมูลจาก Zabbix
ไปที่หน้า Home หรือ ไปที่หน้า http:// ชื่อ หรือ ไอพี :3000

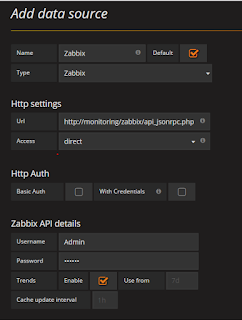
เลือก Add data source

User : ตั้งชื่อ อะไรก็ได้
ติ๊กถูก ที่ Default
Type : Zabbix
Url : http://ไอพี หรือ ชื่อZabbix Server/zabbix/api_jsonrpc.php
Access : direct
User Name : User Zabbix
Password : Password Zabbix
Trends : ติ๊กถูก
หลังจากนั้น ให้ บันทึก
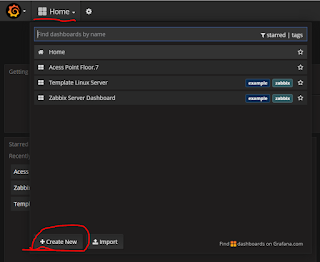
ขั้นตอนการตั้งค่าให้ดึงค่าและแสดงกราฟ

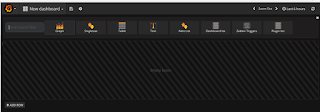
ให้ไปที่ Home ==>>Create New
เลือกรูปแบบกราฟ


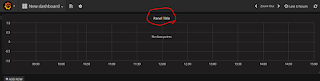
ให้ คลิ๊ก Panel Title ==> Edit

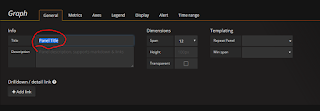
Graph ==>> General
Title คือ ชื่อของ กราฟ

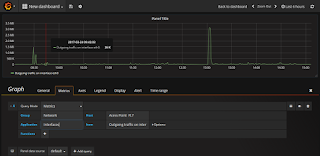
ตั้งค่า Source เพื่อดึงเป็น Report กราฟ
ตัวอย่างทำทำเรียบร้อยแล้ว


